
Arc Virtual Cell Challenge: A Primer on Context Generalization in Transcriptomics
Sources: https://huggingface.co/blog/virtual-cell-challenge, Hugging Face Blog
TL;DR
- Arc Institute’s Virtual Cell Challenge tasks a model with predicting the effect of silencing a gene in unseen cell types, a goal called context generalization.
- The challenge uses a curated dataset of roughly 300k single-cell RNA sequencing profiles; the training set comprises 220k cells, with about 38k unperturbed control cells.
- Arc released STATE, a strong baseline consisting of two transformer-based models: the State Transition Model (ST) and the State Embedding Model (SE).
- The evaluation focuses on Perturbation Discrimination, Differential Expression, and Mean Average Error, with PDiscNorm defined as 1 - 2 * PDisc.
- The work aims to accelerate in silico testing of perturbations, potentially speeding up biology research and drug discovery by tightening feedback loops.
Context and background
Arc Institute recently unveiled the Virtual Cell Challenge. Participants are asked to train a model capable of predicting the effect of silencing a gene in a (partially) unseen cell type, a task they term context generalization. For machine learning engineers with limited biology background, the challenge is framed to be approachable: train a model to predict the cellular impact of CRISPR-based gene silencing. To train the neural network, Arc has curated a dataset of approximately 300k single-cell RNA sequencing (scRNA-seq) profiles. The training set consists of 220k cells, and among them roughly 38k are unperturbed, i.e., they serve as control cells. Each cell is represented by a transcriptome—a sparse row vector where each entry is the raw count of RNA molecules corresponding to the gene in the dataset. The dataset also includes metadata. A concrete example in the dataset is the gene TMSB4X, which is the most frequently silenced in the collection. Comparisons show that cells with TMSB4X silenced have a markedly reduced transcript count relative to control cells. The challenge must contend with the observer effect: measuring a cell’s state before and after perturbation destroys the cell, so control (basal) cells are used as a reference and the true perturbation signal must be disentangled from population heterogeneity. Formally, observed perturbed gene expression is modeled as X^p ∼ T^p(D_basal) + H(D_basal) + ε, with auxiliary representations and noise terms to account for basal heterogeneity. Before Virtual Cell Challenge, Arc released STATE, their own baseline approach to the problem, to give participants a strong starting point. STATE comprises two models: the State Transition Model (ST) and the State Embedding Model (SE). ST acts as the “cell simulator” and accepts either a control cell transcriptome or an embedding from SE, along with a one-hot perturbation vector, to output the perturbed transcriptome. The ST architecture uses a transformer with a Llama backbone and covariate-matched control sets with paired target cells to help isolate the perturbation effect. The control and perturbation tensors are encoded by independent 4-layer MLP encoders with GELU activations; if working in gene expression space, a learned decoder maps the outputs to the predicted transcriptome. ST is trained using Maximum Mean Discrepancy, i.e., minimizing the difference between two probability distributions. SE, a BERT-like autoencoder, builds meaningful cell embeddings by creating gene embeddings first and then aggregating them into a cell representation. To produce a single gene embedding, SE obtains the amino acid sequence for all protein isoforms encoded by the gene (e.g., SDKPDMAEI for TMSB4X), runs them through ESM2, a 15B-parameter Protein Language Model, and pools the per-amino-acid embeddings to create a gene embedding. This gene embedding is projected to the model dimension via a learned encoder that applies a SiLU activation and LayerNorm. The cell embedding is built from the top 2048 genes by log-fold expression; a sequence-like cell sentence is formed as [CLS] token, followed by gene embeddings, and ending with a [DS] token to disentangle dataset-specific effects. A [CLS] token serves as the cell embedding for downstream tasks. The transcriptome is further modulated by an expression “encodings” mechanism that uses a soft binning algorithm and two MLPs to emphasize highly expressed genes. Finally, 1280 genes per cell are masked during training, and the model is tasked with predicting them. For evaluation, Arc uses three metrics: Perturbation Discrimination, Differential Expression, and Mean Average Error (the latter is omitted in some summaries). Perturbation Discrimination measures how well the model distinguishes perturbed transcriptomes; specifically, the Manhattan distance between the predicted perturbed transcriptome and all other perturbed transcriptomes is computed, and the ground-truth perturbed transcriptome’s rank is summarized as r_t. The normalized score, PDisc_t, divides the count by T (the total number of transcriptomes), and the overall PDisc is the mean across perturbations. PDiscNorm is defined as 1 - 2 * PDisc to reflect the baseline of random predictions. Differential Expression assesses the fraction of genes truly affected by the perturbation that are identified as significantly affected. For each gene, a p-value is computed via a Wilcoxon rank-sum test with tie correction, applied to both predicted and ground-truth perturbation distributions, followed by the Benjamini-Hochberg procedure to control for false discovery rate when many genes are considered. These components reflect an architecture and evaluation strategy designed to capture how well a model can generalize perturbation effects across cell types while accounting for underlying biological heterogeneity.
Source: Hugging Face Blog – Arc Virtual Cell Challenge overview and STATE baseline details. Hugging Face Blog
What’s new
Arc’s release of STATE provides a concrete baseline for the Virtual Cell Challenge, consisting of two complementary models: the State Transition Model (ST) and the State Embedding Model (SE).
- ST is described as a transformer-based cell simulator with a Llama backbone. It processes a covariate-matched control set and a perturbation target, each through independent 4-layer MLP encoders with GELU activations. When operating in transcriptome space, ST uses a learned decoder to generate the perturbed transcriptome. Training relies on Maximum Mean Discrepancy to minimize differences between the perturbed and control distributions.
- SE is a BERT-like autoencoder engineered to create meaningful cell embeddings. It builds gene embeddings from protein isoform sequences using ESM2 (a 15B-parameter Protein Language Model), pools them to produce gene embeddings, and projects these into the model’s latent space. A 2048-gene cell sentence is formed with a [CLS] token (the cell embedding) and a [DS] token to disentangle dataset-specific effects. The embedding stack includes an augmentation of gene expressions via a soft binning approach and two MLPs.
- The cell representation in SE+ST emphasizes two parallel encodings: transcriptomic information (the 2048 top-expressed genes) and proteomic-like features (protein isoform embeddings via ESM2).
- The training protocol uses masking of 1280 genes per cell to drive the model to recover missing gene expressions, a strategy aimed at robust generalization to unseen cell types. A compact table ofKey data points from the STATE baseline and the Virtual Cell Challenge dataset is below. | Item | Value |--- |--- |Dataset size | ~300k single-cell RNA sequencing profiles |Training cells | 220k |Control (unperturbed) cells | ~38k | These details illustrate how the challenge balances scale with the need to separate true perturbation signals from basal heterogeneity. The approach integrates transcriptomic and proteomic-inspired representations to improve cross-cell-type generalization.
Why it matters (impact for developers/enterprises)
The Virtual Cell Challenge targets a core bottleneck in biology and drug discovery: testing genetic perturbations without wet-lab experiments. A model capable of simulating the consequences of gene silencing across diverse cell types could shrink the time and cost required to screen perturbations and to interpret how perturbations propagate through cellular networks. Faster feedback loops between hypothesis and prediction can accelerate exploratory research and potentially inform experimental design by highlighting perturbations with the most consistent predicted effects across cell types. The described STATE baseline demonstrates how a combination of transformer architectures, gene- and protein-embeddings, and disentanglement of dataset-specific signals can support context generalization in a high-dimensional, noisy biology setting. The work mirrors broader trends toward in silico experimentation to reduce reliance on physical assays while maintaining biological relevance.
Technical details or Implementation
The following notes summarize core technical elements from the STATE baseline as described by Arc:
- The dataset comprises observed gene expression in perturbed and control cells, with expression modeled as a combination of a baseline transcription program T^p(D_basal), background H(D_basal), and residual noise ε. Predicted perturbed states are denoted as ^X_p and derived from either a raw control transcriptome or a SE embedding, plus a perturbation vector.
- State Transition Model (ST): a transformer-based module with a Llama backbone. It ingests two inputs through independent encoders: control-cell information and perturbation information, each encoded by 4-layer MLPs with GELU activations. If operating in gene-expression space, ST passes a decoder to generate the perturbed transcriptome. ST training uses Maximum Mean Discrepancy to align predicted and true perturbation distributions.
- State Embedding Model (SE): a BERT-like autoencoder that creates rich embeddings for cells and genes. Gene embeddings begin from amino-acid sequences of protein isoforms, processed by ESM2 to produce isoform embeddings, which are pooled to yield a gene embedding. These embeddings are projected to the model dimension with a learned encoder: g ~ _j = SiLU(LayerNorm(g_j W_g + b_g)). The cell embedding comes from a “cell sentence” built from the top 2048 expressed genes (sorted by log fold change). The sentence contains a [CLS] token (the cell embedding) and a [DS] token for disentangling dataset effects. Expression magnitude is modulated by an auxiliary encoding, combining a soft binning scheme with two MLPs to reflect the expression strength of each gene.
- Training and masking: 1280 genes per cell are masked during training, and the model is asked to predict them, focusing on genes spanning a wide range of expression levels.
- Evaluation metrics: Perturbation Discrimination (PDisc) assesses how well predicted perturbations distinguish among perturbed states via Manhattan distances; PDisc is normalized to PDiscNorm = 1 - 2 PDisc. Differential Expression measures the fraction of truly affected genes identified as significantly affected, using Wilcoxon rank-sum tests with tie correction, followed by Benjamini-Hochberg correction for multiple testing. These metrics are designed to quantify both the predictive accuracy and the biological relevance of predicted perturbation effects. These details come from the Arc publication describing STATE and its role as a baseline for the Virtual Cell Challenge. Hugging Face Blog
Key takeaways
- The Virtual Cell Challenge formalizes context generalization for cell perturbations by focusing on unseen cell types and CRISPR-like gene silencing effects.
- The dataset combines a large number of cells with control and perturbed states, emphasizing the need to separate true perturbation signals from basal heterogeneity.
- STATE, the initial baseline, demonstrates an integrated architecture of ST and SE that leverages both transcriptomic and protein-isoform-derived embeddings to support cross-cell-type generalization.
- Evaluation uses a triad of metrics—Perturbation Discrimination, Differential Expression, and Mean Average Error—to capture predictive accuracy and biological relevance.
- The goal is to enable accelerated in silico testing of perturbations, potentially enabling more rapid hypothesis testing and prioritization of experimental work.
FAQ
-
What is the Virtual Cell Challenge?
It is a challenge from Arc Institute to train a model that predicts how a cell responds to silencing a gene, even in cell types not seen during training, i.e., context generalization.
-
How does the STATE baseline operate?
STATE comprises two models: ST, a transformer-based cell simulator, and SE, a BERT-like autoencoder that builds rich cell embeddings from gene and protein isoform information. ST uses covariate-matched controls and a perturbation vector to predict perturbed transcriptomes, trained with Maximum Mean Discrepancy; SE generates gene and cell embeddings using ESM2 protein embeddings and a learned projection to model dimensions.
-
What metrics are used to evaluate predictions?
Perturbation Discrimination (PDisc) measures how well predicted perturbed states distinguish among perturbations, Differential Expression assesses how many truly affected genes are identified as significant, and Mean Average Error provides a straightforward error metric for predicted transcriptomes. PDiscNorm is defined as 1 - 2 * PDisc.
-
Where can I read more about the challenge?
The official write-up and details are available on the Hugging Face blog page dedicated to the Virtual Cell Challenge. [Hugging Face Blog](https://huggingface.co/blog/virtual-cell-challenge)
References
- Hugging Face Blog – Arc Virtual Cell Challenge: A Primer. https://huggingface.co/blog/virtual-cell-challenge
More news

NVIDIA HGX B200 Reduces Embodied Carbon Emissions Intensity
NVIDIA HGX B200 lowers embodied carbon intensity by 24% vs. HGX H100, while delivering higher AI performance and energy efficiency. This article reviews the PCF-backed improvements, new hardware features, and implications for developers and enterprises.

Shadow Leak shows how ChatGPT agents can exfiltrate Gmail data via prompt injection
Security researchers demonstrated a prompt-injection attack called Shadow Leak that leveraged ChatGPT’s Deep Research to covertly extract data from a Gmail inbox. OpenAI patched the flaw; the case highlights risks of agentic AI.

Scaleway Joins Hugging Face Inference Providers for Serverless, Low-Latency Inference
Scaleway is now a supported Inference Provider on the Hugging Face Hub, enabling serverless inference directly on model pages with JS and Python SDKs. Access popular open-weight models and enjoy scalable, low-latency AI workflows.

Microsoft to turn Foxconn site into Fairwater AI data center, touted as world's most powerful
Microsoft unveils plans for a 1.2 million-square-foot Fairwater AI data center in Wisconsin, housing hundreds of thousands of Nvidia GB200 GPUs. The project promises unprecedented AI training power with a closed-loop cooling system and a cost of $3.3 billion.

Reddit Pushes for Bigger AI Deal with Google: Users and Content in Exchange
Reddit seeks a larger licensing deal with Google, aiming to drive more users and access to Reddit data for AI training, potentially via dynamic pricing and traffic incentives.
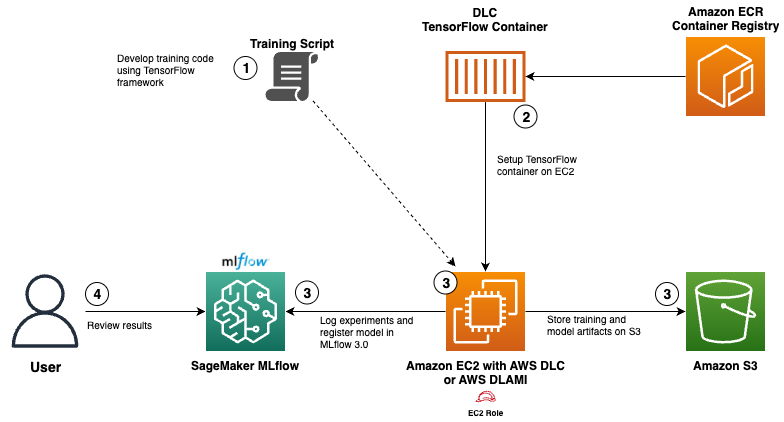
Use AWS Deep Learning Containers with Amazon SageMaker AI managed MLflow
Explore how AWS Deep Learning Containers (DLCs) integrate with SageMaker AI managed MLflow to balance infrastructure control and robust ML governance. A TensorFlow abalone age prediction workflow demonstrates end-to-end tracking, model governance, and deployment traceability.